Pharmacist Salary in Grants Pass, OR: $144,690 (2026)
Quick Answer:A full-time pharmacist in Grants Pass, OR earns a median $144,690/year (≈ $69.56/hour) in nominal terms for 2026 — projected from BLS OEWS 2025 (SOC 29-1051). Once you factor in Grants Pass's price level (2% below national, BEA RPP 97.8), that paycheck buys what $148,005 would nationally. Nominal pay sits 13.8% below the Oregon state average.
Official BLS data · View source
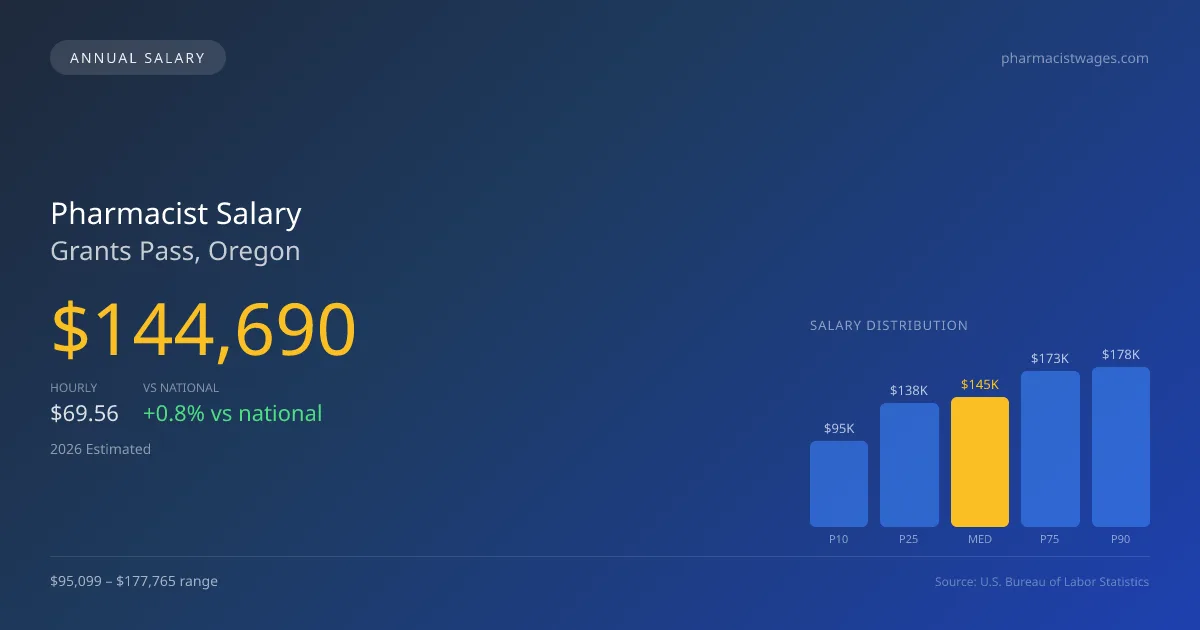
In Grants Pass, OR, the pharmacist salary is projected to reach a median of $144,690 in 2026, slightly above the national median of $143,489, reflecting a modest growth of 1.83% in the local market. The salary range for pharmacists here is notable, spanning from $95,099 at the lower end to $177,765 at the upper end, illustrating the diverse compensation landscape influenced by various work settings and roles within the pharmacy profession. This data comes from detailed surveys conducted by the Bureau of Labor Statistics (BLS) and highlights the impact of recent retail chain consolidations, which have reshaped local employment dynamics while also contributing to adjustments in pharmacist pay in Grants Pass.
Salary Breakdown
| Percentile | Annual | Hourly |
|---|---|---|
| Entry Level (P10) | $95,099 | $45.72 |
| Lower Range (P25) | $137,583 | $66.15 |
| Median (P50)(typical) | $144,690 | $69.56 |
| Upper Range (P75) | $173,366 | $83.35 |
| Top Earners (P90) | $177,765 | $85.47 |
Median Salary Position
0.84% above the national average
2026 Salary Percentile Distribution in Grants Pass
In Grants Pass, OR, the pharmacist salary spread from the 10th to 90th percentile is $82,666 (2026 est.). At $144,690, the local median is 0.84% above the national median of $143,489.
Salary Calculator
At 40 hours/week in Grants Pass: You'd be above the median
How Grants Pass Pharmacist Pay Compares
Grants Pass median: $144,690/year (2026)
| Compared To | Median Salary | Grants Pass Pays |
|---|---|---|
| Oregon Average | $167,854 | -13.80% less |
| National Average | $143,489 | +0.84% more |
Pharmacists in Grants Pass, OR earn a median of $144,690 per year (2026 est.), which is 0.84% higher than the national median of $143,489 and 13.80% below the Oregon state average of $167,854.
Cost-of-Living Adjusted Salary
Grants Pass has a cost of living 2.24% below the national average, meaning your salary goes further here.
Adjusted salary = nominal × (100 / CoL index). CoL index: 100 = national average.
Grants Pass, OR has a cost-of-living index of 97.76 (below the national average of 100). A pharmacist earning $144,690 nominally has purchasing power equivalent to $148,005 in an average-cost city — an effective 2.29% boost.
Compare Purchasing Power
Select a city to see how your salary compares after cost of living
Select a city above to compare purchasing power
2019 BLS Actual
$148,350
2025 BLS Actual
$142,090
2026 Current Est.
$144,690
2019–2027 Growth
+-0.7%
Salary Trajectory for Pharmacists in Grants Pass (2019–2027)
2019–2025: actual BLS OEWS data for this metro area. 2026+: CAGR 1.83% projection.
| Year | Annual Salary | Status |
|---|---|---|
| 2019 | $148,350 | Actual |
| 2020 | $142,620 | Actual |
| 2021 | $130,070 | Actual |
| 2022 | $138,370 | Actual |
| 2023 | $132,650 | Actual |
| 2024 | $150,090 | Actual |
| 2025 | $142,090 | Actual |
| 2026(current) | $144,690 | Estimated |
| 2027 | $147,338 | Projected |
Based on 7 years of BLS OEWS data for the Grants Pass metropolitan area, the median pharmacist salary grew -4.2% from $148,350 (2019) to $142,090 (2025). At a 1.83% compound annual growth rate, salaries are projected to reach $147,338 by 2027 — a total increase of $-1,012 (-0.68%) from 2019.
Note: Historical values (2019–2025) are actual BLS OEWS figures for the Grants Pass metropolitan area, sourced from annual Occupational Employment and Wage Statistics surveys. 2026–2026 figures are current estimates, and 2027 values are projections, calculated using a 1.83% CAGR derived from 7-year BLS historical data. Actual salaries may vary based on employer, experience, certifications, and local market conditions.
Salary by Experience Level
| Experience | Estimated Salary Range |
|---|---|
| 0-2 years (New Graduate) | $95,099 – $137,583 |
| 3-5 years (Mid Career) | $137,583 – $144,690 |
| 5+ years (Experienced) | $144,690 – $173,366 |
| 10+ years (Top Earner) | $173,366 – $177,765 |
PharmD salary ranges estimated from BLS percentile data. Individual pharmacist compensation varies by employer, certifications, and specialization.
Pharmacist Job Market in Grants Pass
With a workforce of 50 pharmacists in the area, the local job market is relatively stable, though the cost-of-living index currently sits at 97.76, indicating that take-home pay might stretch further than in regions with a higher cost of living. In this context, retail pharmacy chains like CVS, Walgreens, and Walmart tend to offer competitive salaries, with hospitals and specialty pharmacies also emerging as strong employers. The spread in pharmacist pay can be driven by numerous factors, such as board certification stipends, shift differentials, and the impact of recent retail consolidation on the availability of certain positions. To maximize compensation in this market, pharmacists should consider pursuing additional credentials or certifications that can qualify them for higher-paying roles, such as those in hospital settings or specialty pharmacies, while also being mindful of shifts in hiring trends and job availability caused by recent industry transformations.
More salary data for Grants Pass, OR:
Frequently Asked Questions
How much do pharmacists make in Grants Pass, OR in 2026?
Is Grants Pass, OR a good place to work as a pharmacist?
Can pharmacists make $100K in Grants Pass?
What is the cost-of-living adjusted pharmacist salary in Grants Pass?
How much does a pharmacist make per hour in Grants Pass?
Related Pages
Compare Salaries
Career Resources
Nearby Cities in Oregon
Written by Sofia Chen, PharmD
Career Analyst
Sofia Chen has 10 years of experience in community pharmacy. She specializes in medication therapy management.
Methodology & Data Source
Salary figures on this page are 2026 projections based on the Bureau of Labor Statistics Occupational Employment and Wage Statistics (OEWS) survey, May 2026 release. The BLS reported a median annual salary of $142,090 for pharmacistsin the Grants Pass metropolitan area. A 1.83% compound annual growth rate (CAGR), calculated from 6-year national BLS wage trends, was applied to project current 2026 compensation. Percentile ranges (P10–P90) represent the full salary distribution across experience levels and practice settings in this market.
Data Sources & Methodology
Source: BLS, OEWS, 7-year dataset (–). Per-city data from annual BLS metropolitan area surveys.
2026 figures are projected from 2025 BLS data using a compound annual growth rate (CAGR) of 1.83%, derived from historical BLS wage trends for pharmacists (SOC 29-1051).
Compiled and verified by Sofia Chen, PharmD, a licensed pharmacist with 10+ years of clinical experience. · View source data at BLS.gov