Pharmacist Salary in Massachusetts: $141,534 (2026)
Quick Answer:Across Massachusetts's 59 metropolitan areas, the average median pharmacist pay sits at $141,534/year heading into 2026 — a figure projected from 2025 BLS OEWS wage data for SOC 29-1051. Because Massachusetts sits at BEA RPP 108.5 (9% above the U.S. baseline), that statewide median translates to roughly $130,446 in nationally-comparable purchasing power. Highest-paying metros: Barnstable Town ($150,850), Lynn ($142,709), Somerville ($140,840).
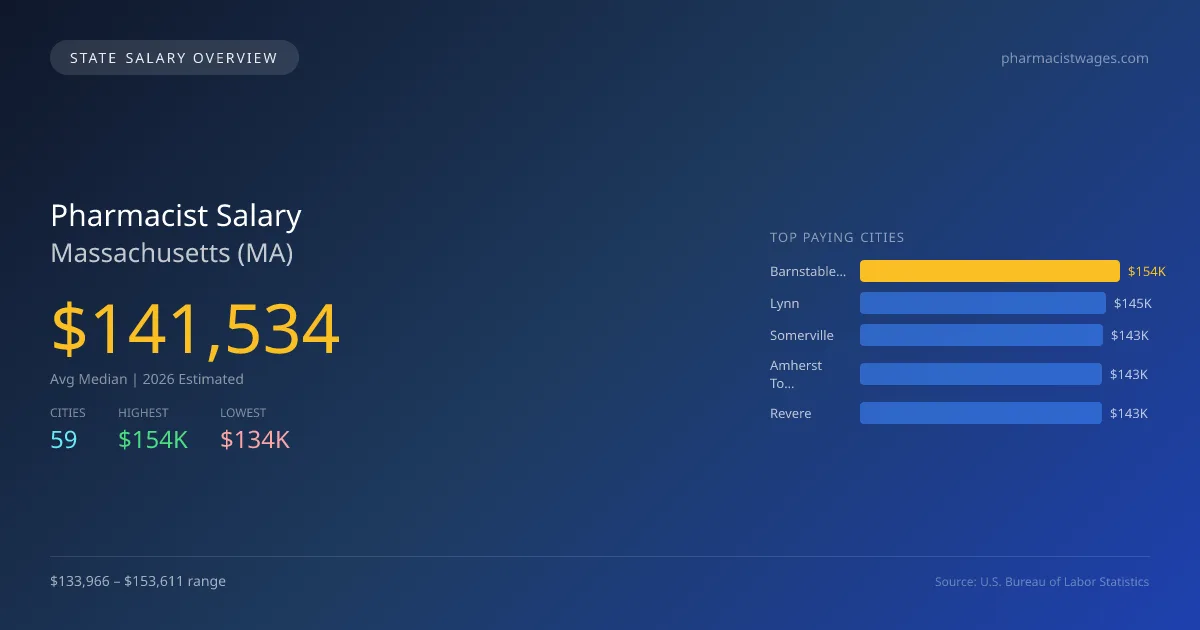
In Massachusetts, the projected average median salary for pharmacists in 2026 is $141,534, slightly lower than the national median of $143,489, reflecting a difference of about 1.4%. The salary landscape varies considerably across the state, with Barnstable Town leading at $153,611, while Andover offers the lowest salary at $133,966, creating a gap of $19,645 between these cities. This disparity is often attributed to factors such as local cost of living, demand for pharmacy services, and the presence of healthcare institutions. Massachusetts has specific licensing requirements and scope of practice laws that can influence salary levels. Pharmacists must hold a Doctor of Pharmacy (Pharm.D.) and pass multiple examinations, ensuring a highly trained workforce capable of meeting the state's healthcare needs. The demand for pharmacists remains strong, with a projected annual growth rate of 1.83%. Among the top projected cities for salaries in 2026, Lynn is forecasted at $145,321, Somerville at $143,417, Amherst Town at $143,224, and Revere at $143,193, indicating varied opportunities within the state. Overall, the pharmacist job market in Massachusetts is stable, driven by ongoing needs in pharmaceutical care and public health.
Massachusetts Pharmacist Salary Range
Overall salary range in Massachusetts: $60,528 (lowest entry-level) to $183,457 (highest top earner)
Massachusetts vs National Average
Massachusetts pharmacists earn 1.36% less than the national median ($-1,955/year difference).
Massachusetts Pharmacist Salary Distribution (2026)
Pharmacist salaries in Massachusetts range from $119,764 (entry-level, 10th percentile) to $169,807 (top earners, 90th percentile), with a median of $141,534. The Massachusetts median is $1,955 below the US national median of $143,489. The average hourly rate is $68.04/hr. Approximately 7,447 pharmacists are employed across 59 cities.
2019 BLS Actual
$123,567
2025 BLS Actual
$138,990
2026 Current Est.
$141,534
2019–2027 Growth
+16.6%
Salary Trajectory for Pharmacists in Massachusetts (2019–2027)
2019–2025: actual BLS OEWS data for this metro area. 2026+: CAGR 1.83% projection.
| Year | Annual Salary | Status |
|---|---|---|
| 2019 | $123,567 | Actual |
| 2020 | $125,367 | Actual |
| 2021 | $128,339 | Actual |
| 2022 | $131,825 | Actual |
| 2023 | $136,946 | Actual |
| 2024 | $137,582 | Actual |
| 2025 | $138,990 | Actual |
| 2026(current) | $141,534 | Estimated |
| 2027 | $144,124 | Projected |
Based on 7 years of BLS OEWS data for the Massachusetts metropolitan area, the median pharmacist salary grew 12.5% from $123,567 (2019) to $138,990 (2025). At a 1.83% compound annual growth rate, salaries are projected to reach $144,124 by 2027 — a total increase of $20,557 (16.64%) from 2019.
Note: Historical values (2019–2025) are actual BLS OEWS figures for the Massachusetts metropolitan area, sourced from annual Occupational Employment and Wage Statistics surveys. 2026–2026 figures are current estimates, and 2027 values are projections, calculated using a 1.83% CAGR derived from 7-year BLS historical data. Actual salaries may vary based on employer, experience, certifications, and local market conditions.
Top 5 Highest Paying Cities in Massachusetts
Lowest Paying Cities in Massachusetts
| City | Median Salary |
|---|---|
| Andover | $133,966 |
| Leominster | $134,295 |
| Wellesley | $134,416 |
| Chelmsford | $134,493 |
| Woburn | $134,613 |
Best Value Cities for Pharmacists in Massachusetts
When adjusted for local cost of living, these Massachusetts cities offer the most purchasing power for pharmacists.
| City | Nominal Salary | CoL Index | Adjusted Salary |
|---|---|---|---|
| Barnstable Town | $153,611 | 98.351 | $156,187 |
| Pittsfield | $140,434 | 95.106 | $147,661 |
| Springfield | $140,760 | 96.061 | $146,532 |
| Amherst Town | $143,224 | 100.243 | $142,877 |
| Lynn | $145,321 | 108.5 | $133,936 |
Adjusted salary = nominal salary × (100 / CoL index). CoL index: 100 = national average. Lower index = lower cost of living.
Salary by Experience Level in Massachusetts
| Experience Level | Estimated Annual |
|---|---|
| Entry Level (0-2 years) | $119,764 |
| Mid Career (3-7 years) | $141,534 |
| Experienced (7+ years) | $169,807 |
Estimates based on BLS percentile data averaged across Massachusetts metro areas. Individual pay varies by employer, certifications, and specialization.
All 59 Cities in Massachusetts
| # | City | Median Salary |
|---|---|---|
| 1 | Barnstable Town | $153,611 |
| 2 | Lynn | $145,321 |
| 3 | Somerville | $143,417 |
| 4 | Amherst Town | $143,224 |
| 5 | Revere | $143,193 |
| 6 | Brockton | $142,703 |
| 7 | New Bedford | $142,543 |
| 8 | Plymouth | $142,454 |
| 9 | Boston | $142,216 |
| 10 | Malden | $141,939 |
| 11 | Haverhill | $141,916 |
| 12 | Lowell | $141,880 |
| 13 | Framingham | $141,816 |
| 14 | Peabody | $141,625 |
| 15 | Northampton | $141,328 |
| 16 | Weymouth | $141,198 |
| 17 | Newton | $141,072 |
| 18 | Chicopee | $140,773 |
| 19 | Springfield | $140,760 |
| 20 | Randolph | $140,619 |
| 21 | Pittsfield | $140,434 |
| 22 | Quincy | $140,371 |
| 23 | Amherst | $140,202 |
| 24 | Chelsea | $140,191 |
| 25 | Medford | $139,810 |
| 26 | Fall River | $139,675 |
| 27 | Marlborough | $139,675 |
| 28 | Watertown | $139,653 |
| 29 | Fitchburg | $139,544 |
| 30 | Methuen | $139,490 |
| 31 | Taunton | $139,429 |
| 32 | Arlington | $139,379 |
| 33 | Needham | $139,016 |
| 34 | Westfield | $138,950 |
| 35 | Everett | $138,929 |
| 36 | Cambridge | $138,820 |
| 37 | Holyoke | $138,215 |
| 38 | Beverly | $137,984 |
| 39 | Lawrence | $137,983 |
| 40 | Dartmouth | $137,820 |
| 41 | Waltham | $137,680 |
| 42 | Barnstable | $137,534 |
| 43 | Brookline | $137,232 |
| 44 | Billerica | $137,018 |
| 45 | Braintree | $136,557 |
| 46 | Salem | $136,326 |
| 47 | Natick | $136,238 |
| 48 | Dracut | $135,525 |
| 49 | Lexington | $135,437 |
| 50 | Stoughton | $135,437 |
| 51 | Worcester | $135,363 |
| 52 | Shrewsbury | $135,261 |
| 53 | Franklin | $134,899 |
| 54 | Attleboro | $134,789 |
| 55 | Woburn | $134,613 |
| 56 | Chelmsford | $134,493 |
| 57 | Wellesley | $134,416 |
| 58 | Leominster | $134,295 |
| 59 | Andover | $133,966 |
More Massachusetts Salary Data
Hourly Rates
Explore pharmacist hourly pay in Massachusetts cities.
Senior / Experienced
Top earner salaries for experienced pharmacists.
Compare Cities in Massachusetts
View all comparisons →Explore More Pharmacist Salary Data
Frequently Asked Questions
How much do pharmacists make in Massachusetts in 2026?
What is the highest paying city for pharmacists in Massachusetts?
How does Massachusetts pharmacist pay compare to the national average?
What is the entry-level pharmacist salary in Massachusetts?
How many pharmacists are employed in Massachusetts?
Which Massachusetts city offers the best value for pharmacists?
Written by Sofia Chen, PharmD
Career Analyst
Sofia Chen has 10 years of experience in community pharmacy. She specializes in medication therapy management.
Methodology & Data Source
Statewide salary figures on this page are 2026 projections based on the Bureau of Labor Statistics Occupational Employment and Wage Statistics (OEWS) survey, May 2026 release. A 1.83% compound annual growth rate (CAGR), derived from 6-year national BLS wage trends, was applied to each metro area's reported salary to estimate current 2026 pharmacist compensation across Massachusetts. State averages are employment-weighted across 59 metro areas — larger metro areas with more pharmacistscontribute proportionally more to the average, producing figures that better reflect typical compensation. Individual pay varies by city, employer, certifications, and experience.
Data Sources & Methodology
Source: BLS, OEWS, 7-year dataset (–). Per-city data from annual BLS metropolitan area surveys.
2026 figures are projected from 2025 BLS data using a compound annual growth rate (CAGR) of 1.83%, derived from historical BLS wage trends for pharmacists (SOC 29-1051).
Compiled and verified by Sofia Chen, PharmD, a licensed pharmacist with 10+ years of clinical experience. · View source data at BLS.gov